U.S. Coal Reserves

 
2005 U.S. Demonstrated Coal Reserve Base (millions of tons)

The U.S. Demonstrated Coal Reserve Base is an estimate of the tonnage of economically available coal.**


Coal Producing
Region and State


Anthracite


Bituminous


Sub-Bituminous


Lignite

Total**
(millions of tons)


Appalachian Region


Alabama

3,158.77

1,083.00

4,241.77

Georgia

3.60

3.60

Kentucky, Eastern

10,671.35

10,671.35

Maryland

651.51

651.51

North Carolina

10.70

10.70

Ohio

23,342.49

23,342.49

Pennsylvania

7,200.47

20,396.73

27,597.20

Tennessee

779.26

779.26

Virginia

125.49

1,614.23

1,739.72

West Virginia

33,220.10

33,220.10


Appalachian Total

7,325.96

93,848.74

1,083.00

102,257.70


Interior Region


Arkansas

104.00

287.40

25.37

416.77

Illinois

104,528.89

104,528.89

Indiana

9,534.47

9,534.47

Iowa

2,189.45

2,189.45

Kansas

972.56

972.56

Kentucky, Western

19,553.67

19,553.67

Louisiana

426.71

426.71

Michigan

127.70

127.70

Missouri

5,989.93

5,989.93

Oklahoma

1,556.83

1,556.83

Texas

12,442.36

12,442.36


Interior Total

104.00

144,740.90

12,894.44

157,739.34


Western Region          

Alaska

697.51

5,400.36

14.00

6,111.87

Arizona

6.67

6.67

Colorado

25.50

8,330.08

3,747.27

4,189.86

16,292.71

Idaho

4.42

4.42

Montana

1,385.38

102,138.45

15,756.52

119,280.35

New Mexico

2.30

3,598.65

8,571.28

12,172.22

North Dakota

9,090.13

9,090.13

Oregon

17.45

17.45

South Dakota

366.10

366.10

Utah

5,443.76

1.10

5,444.86

Washington

303.71

1,028.94

8.07

1,340.72

Wyoming

4,318.15

60,006.97

64,325.12


Western Total

27.80

24,088.33

180,911.82

29,424.68

234,452.64


U.S. Total

7,457.76

262,677.97

180,911.82

43,402.12

494,449.67


East of the Mississippi

236,002.42


West of the Mississippi

 258,447.25


**Kentucky coal resource values are considered by some to be too high, while the Eastern Kentucky "Demonstrated Coal Reserve Base" value is still openly rejected by many as being too low.

Source: U.S. DOE - EIA, U.S. Coal Reserves: 2005 Update (January 2005)

http://www.eia.doe.gov/fuelcoal.html

Eastern Kentucky Low-Sulfur Coal

The U.S. DOE estimates that over 32.3% of Eastern Kentucky’s Demonstrated Reserve Base (DRB) would meet a 0.6 pounds of sulfur dioxide per million Btu emissions limit (low sulfur), and that 45.9% would meet a 1.67 lb/mm Btu emissions limit (medium sulfur).

Summary Sulfur Content Categories*
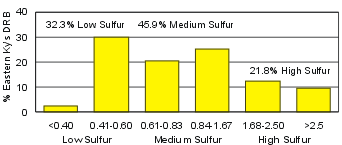

Sulfur Dioxide Emission Category (lb SO2 / mmBtu)

Converting "Percent Sulfur"
to "lb SO2 per million Btu"
lb SO2 / mmBtu =
%S X 19,500
Btu/lb of coal 

Examples for 12,500 Btu coal:

% Sulfur
1.0%
0.9%
0.8%
0.7%

lb/mm Btu
1.56
1.40
1.25
1.09

NOTE: Change % sulfur to Sulfur Dioxide Emission Category (lb SO2 / mmBtu) comparisons.
*EIA uses 6 sulfur content ranges. For general discussion and summary data, however, those 6 ranges are combined into 3 qualitative ratings of low, medium, and high-sulfur content.