|
County Production |
|
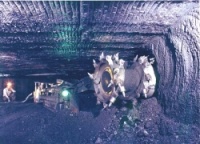
245 underground mines (302 licenses) accounted for 61.0% of Kentucky’s production and 375 surface mines (345 licenses) accounted for 39.0% of Kentucky’s production. 88% of Western Kentucky and 53% of Eastern Kentucky's coal production was from underground mines during 2006. In 2006, 32 Kentucky counties produced coal; eight Western Kentucky counties and 24 Eastern Kentucky counties. |
|
2006 Production by County and Type of Mine License* |
|
Underground |
Surface |
Total |
||||
|
County |
Licenses |
Tonnage |
Licenses |
Tonnage |
Licenses |
Tonnage |
|
Eastern Kentucky |
||||||
|
Bell |
8 |
1,012,546 |
23 |
1,742,281 |
31 |
2,754,827 |
|
Breathitt |
2 |
,
- |
7 |
1,598,788 |
9 |
2,286,454 |
|
Clay |
3 |
101,536 |
7 |
94,819 |
10 |
196,355 |
|
Elliott |
- |
- |
1 |
20,000 |
1 |
20,000 |
|
Floyd |
39 |
1,948,958 |
21 |
2,034,108 |
60 |
3,983,066 |
|
Harlan |
50 |
8,585,933 |
26 |
3,249,239 |
76 |
11,835,172 |
|
Jackson |
- |
- |
7 |
66,036 |
7 |
66,036 |
|
Johnson |
2 |
1,543,278 |
11 |
387,329 |
13 |
1,930,607 |
|
Knott |
31 |
5,317,885 |
22 |
3,662,497 |
5 |
8,980,382 |
|
Knox |
10 |
221,085 |
10 |
453,037 |
20 |
674,122 |
|
Laurel |
- |
- |
2 |
134,799 |
2 |
134,799 |
|
Lawrence |
3 |
209,470 |
13 |
883,153 |
16 |
1,092,623 |
|
Lee |
- |
- |
1 |
24,084 |
1 |
24,084 |
|
Leslie |
5 |
3,096,748 |
10 |
1,789,424 |
15 |
4,886,172 |
|
Letcher |
26 |
6,342,546 |
34 |
3,480,209 |
60 |
9,822,755 |
|
Magoffin |
- |
- |
4 |
2,053,610 |
4 |
2,053,610 |
|
Martin |
13 |
2,726,415 |
14 |
2,067,572 |
27 |
4,793,987 |
| Morgan | 2 | 771 | 6 | 80,237 | 8 | 81,008 |
|
Owsley |
- |
- |
4 |
106,125 |
4 |
106,125 |
|
Perry |
10 |
4,154,284 |
28 |
9,884,628 |
38 |
14,038,912 |
|
Pike |
82 |
14,884,057 |
73 |
11,509,998 |
155 |
26,394,055 |
|
Whitley |
1 |
20,774 |
1 |
148,712 |
2 |
169,486 |
|
Wolfe |
- |
- |
2 |
6,294 |
2 |
6,294 |
|
EKY Total |
287 |
50,853,952 |
328 |
45,537,968 |
615 |
96,391,920 |
| Western Kentucky | ||||||
|
Crittenden |
- |
- |
1 |
32,668 |
1 |
32,668 |
|
Daviess |
- |
- |
1 |
1,808 |
1 |
1,808 |
|
Henderson |
1 |
1,870,214 |
1 |
1,296,328 |
2 |
3,166,542 |
|
Hopkins |
6 |
11,292,382 |
7 |
191,512 |
13 |
11,483,894 |
|
Muhlenberg |
2 |
2,342,190 |
6 |
1,879,959 |
8 |
4,222,149 |
|
Ohio |
1 |
1,284,459 |
- |
- |
1 |
1,284,459 |
|
Union |
2 |
4,851,334 |
1 |
194,736 |
3 |
5,046,070 |
|
Webster |
3 |
4,331,101 |
- |
- |
3 |
4,331,101 |
|
WKY Total |
15 |
25,971,680 |
17 |
3,597,011 |
32 |
29,568,691 |
|
KY Totals |
302 |
76,825,632 |
345 |
49,134,979 |
647 |
125,960,611 |
| *NOTE: The number of licenses are greater than the number of mines because a mine may be relicensed if the the company changes name or ownership. Source: Kentucky Office of Mine Safety and Licensing Annual Report, 2006. |